
Sahara is the all-in-one system for reservoir visualization, analysis, and monitoring.
Sahara is a reservoir visualization, analysis, and monitoring system.
Sahara enables optimized decision-making in reservoir management and production. With more than 40 specialized tools, it simplifies daily tasks, allowing more time for data analysis.
Clients
Present in multiple countries, we are trusted by numerous companies to support their operations.
Why Sahara?
Centralized and Interactive Data Management
Sahara centralizes all the information needed for reservoir management and production within a single project. This ensures that data is organized in a structured way, making it easier to access and perform comprehensive analyses without relying on multiple sources.
Additionally, Sahara features interactive windows that provide integrated access to information, offering a dynamic and intuitive workflow. A wide range of charts offers multiple visualization options, allowing users to choose the best way to represent their data or combine different views to extract more detailed insights from a single analysis.
Advanced Diagnostic Tools
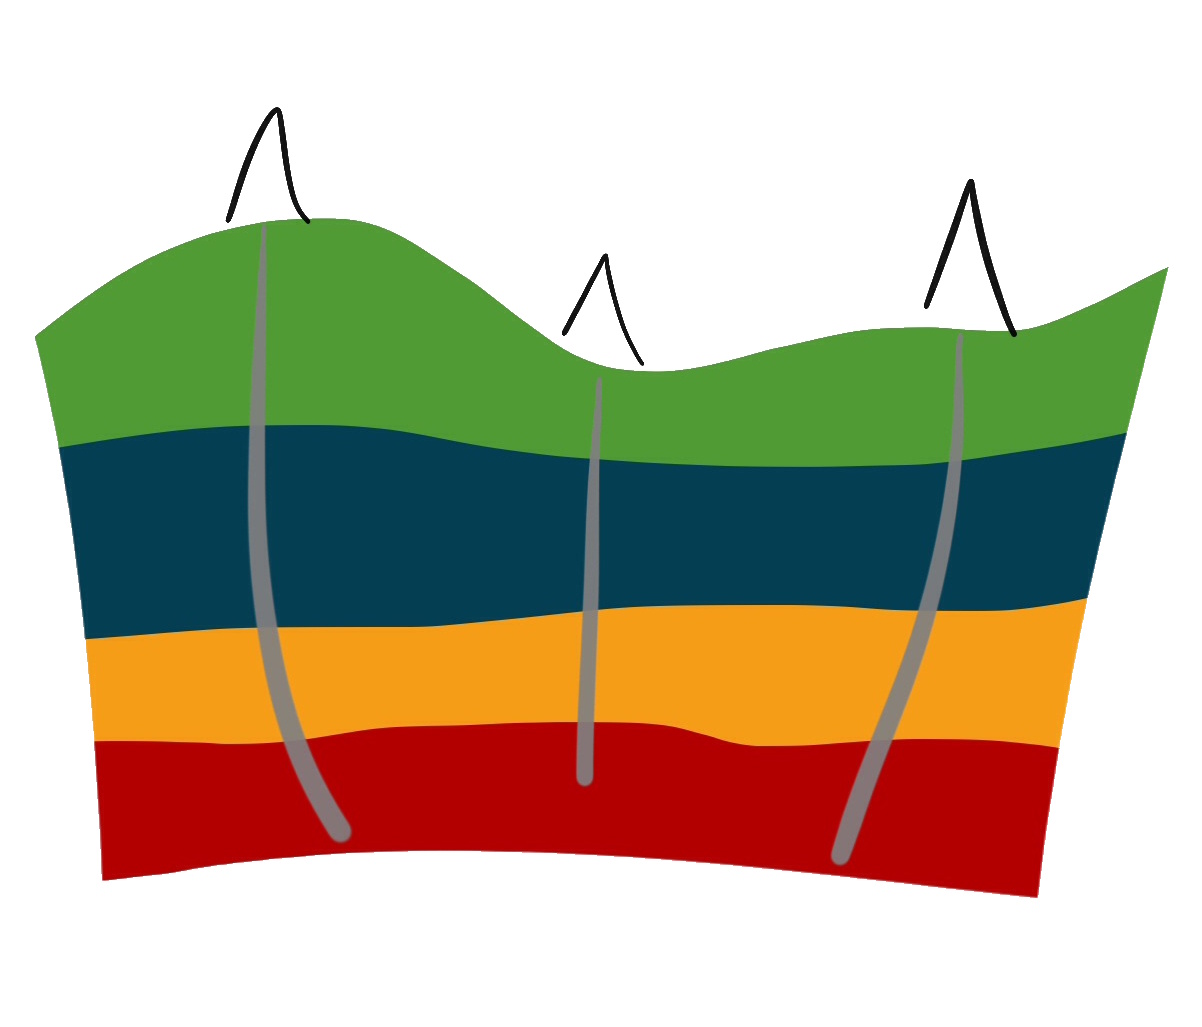
From basic field information, such as wells, profiles, production data, petrophysical data, and interventions, to production forecasting and specialized analyses, Sahara provides a complete environment. Its ability to integrate all this data into a single platform enables accurate diagnostics and helps optimize production efficiently.
Additionally, with its calculation tools, users can quickly obtain key results for reservoir monitoring and analysis, streamlining decision-making and improving operational efficiency.
Specialized Solutions for Unconventional Reservoirs
Sahara incorporates advanced tools for unconventional reservoirs.
In line with our innovation strategy, we have developed specialized features for the historical analysis of individual wells and well groups, providing key insights to optimize decision-making and improve field performance.
Features
Conectivity
Sahara offers great flexibility in data import, allowing users to import and export data directly in all standard E&P application formats.
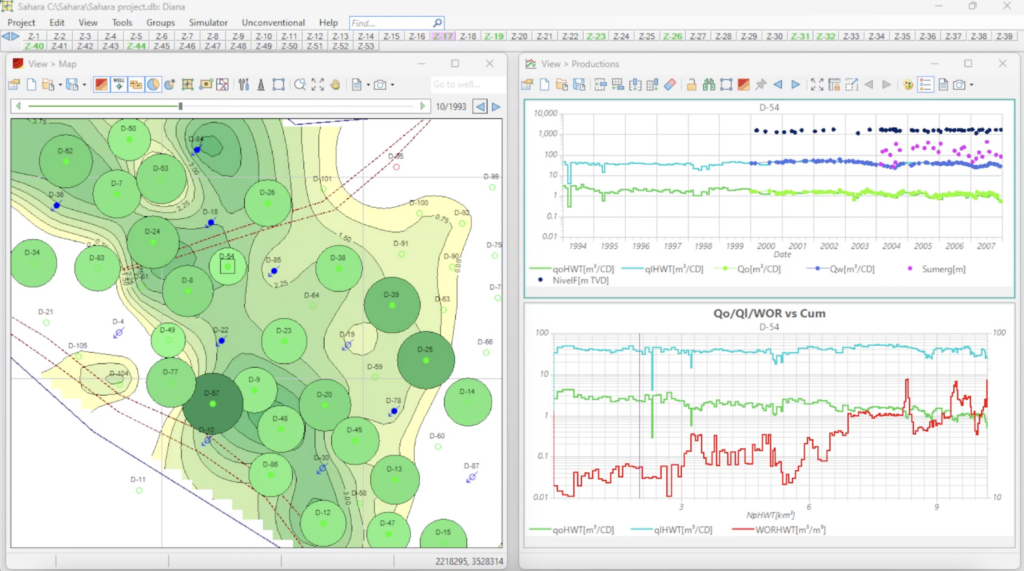
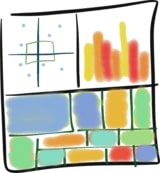
Map window
It could be considered one of the main windows in a Sahara project. Wells are displayed across the project area, positioned according to their location. By using attribute values, they can be identified with different symbols and colors.
Wells information
Sahara provides visualization of various types of information stored in a project through dedicated windows, ensuring organized and comprehensive access to all data.
Wells management
Sahara offers, within the Groups menu, the ability to filter, select and group wells using various tools, making it easier to review and analyze information.
Diagnosis and Monitoring
Sahara provides a variety of diagnostic tools for managing oil and gas production fields.
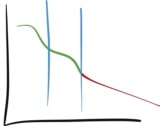
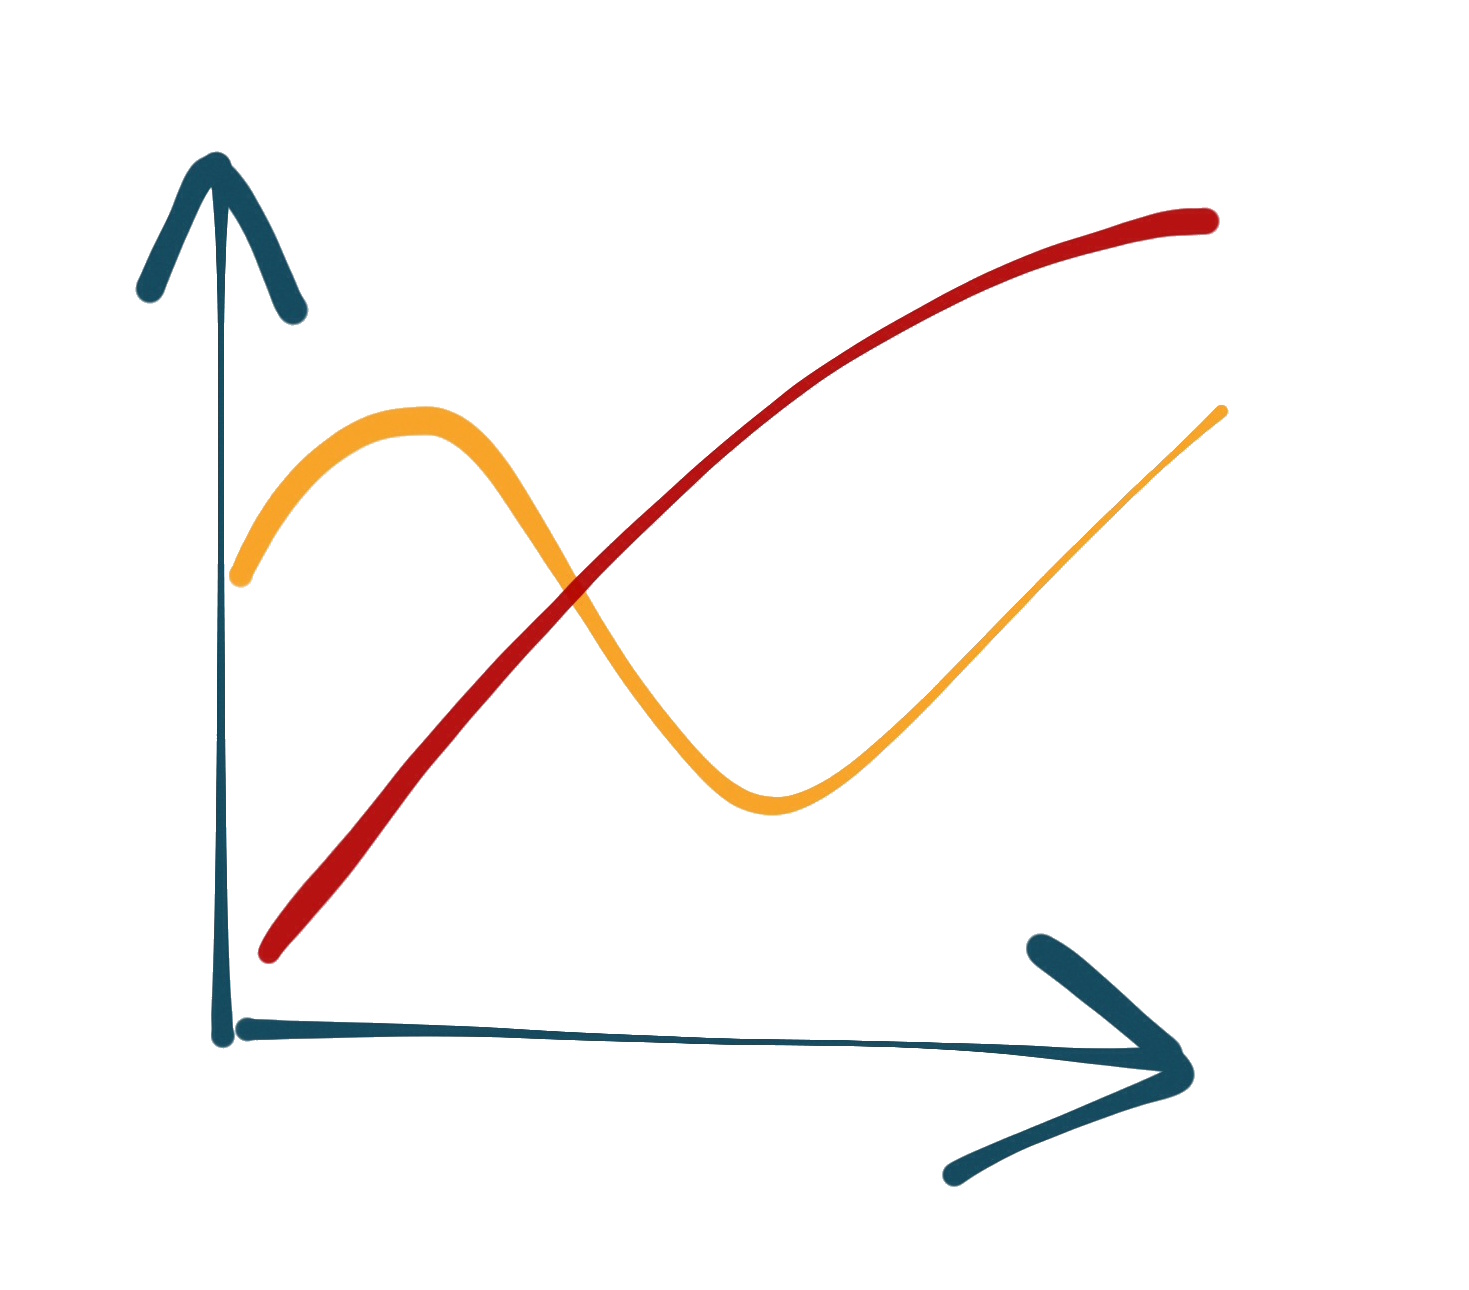
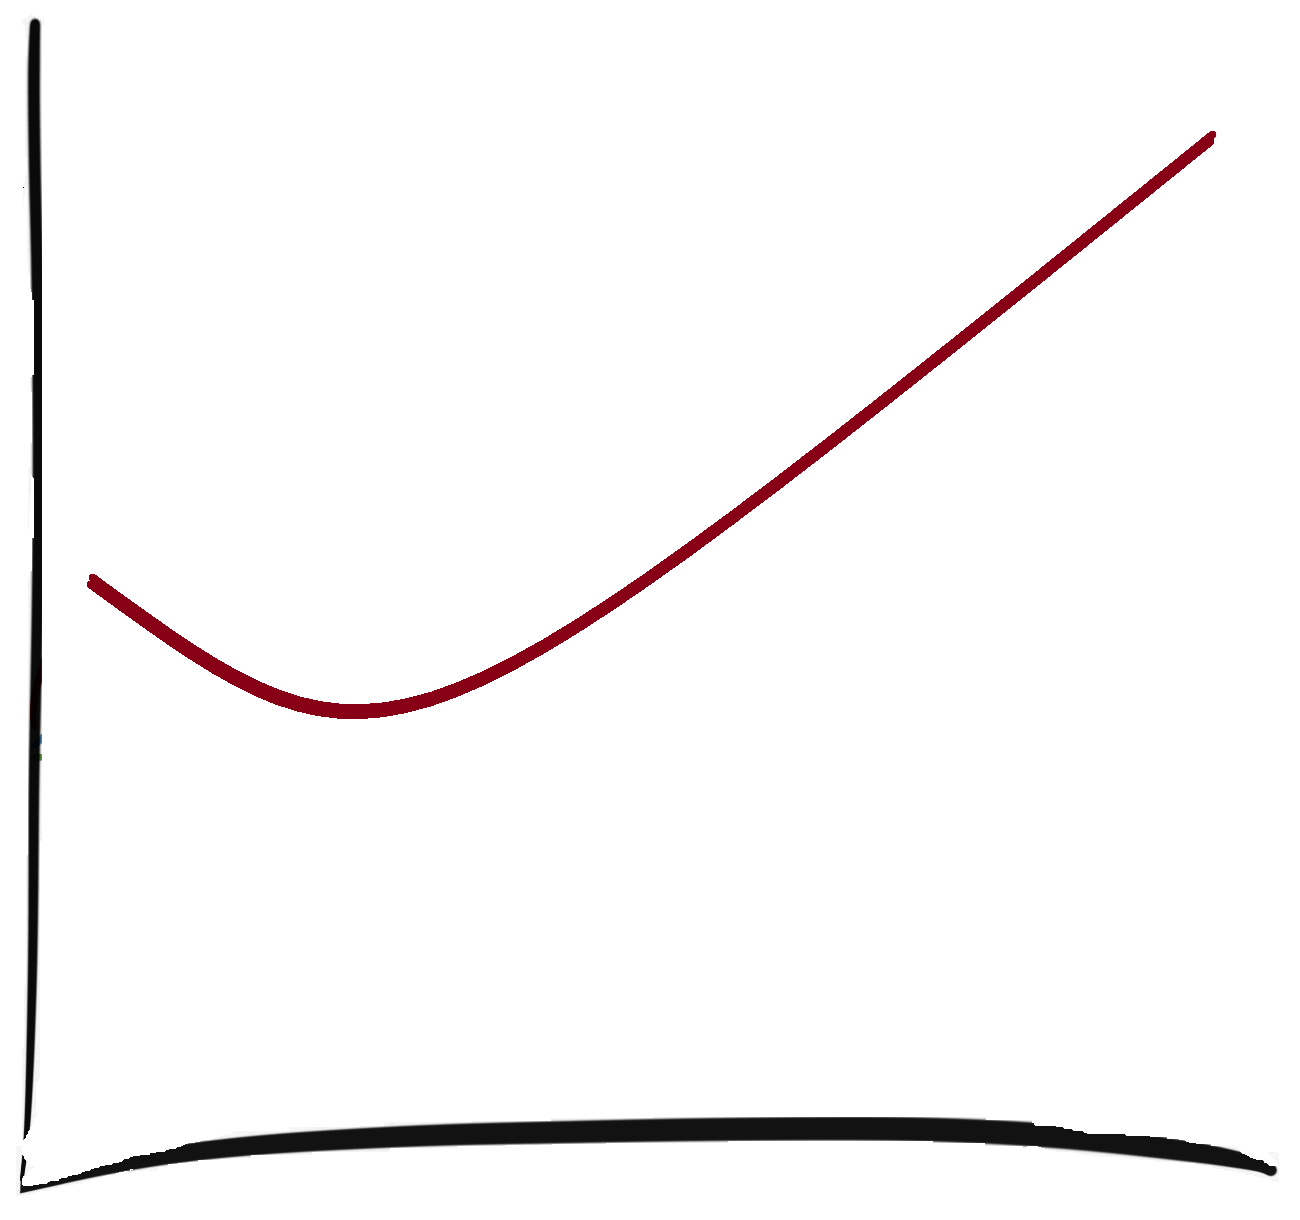
Declines
Through the analysis of decline curves at the well or group level, historical adjustments and forecasts can be made.
Petrophysical tools
Sahara provides all the necessary tools for performing classical log interpretations and petrophysical analysis.
Geology – General tools
Sahara has a wide range of tools for generating information that can be used for various analyses.
Production and Wellworks – General tools
Sahara has a wide range of tools for generating information that can be used for various analyses.
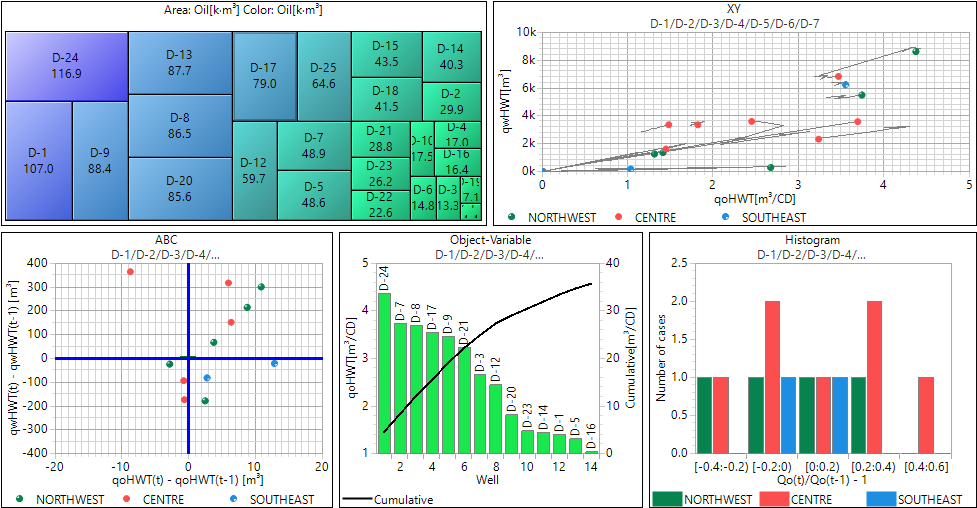
Statistical tools
Sahara offers a wide range of continuous and discrete probability distributions. These can be used to perform statistical analysis on the values of multiple variables and define hypotheses for a Monte Carlo simulation.
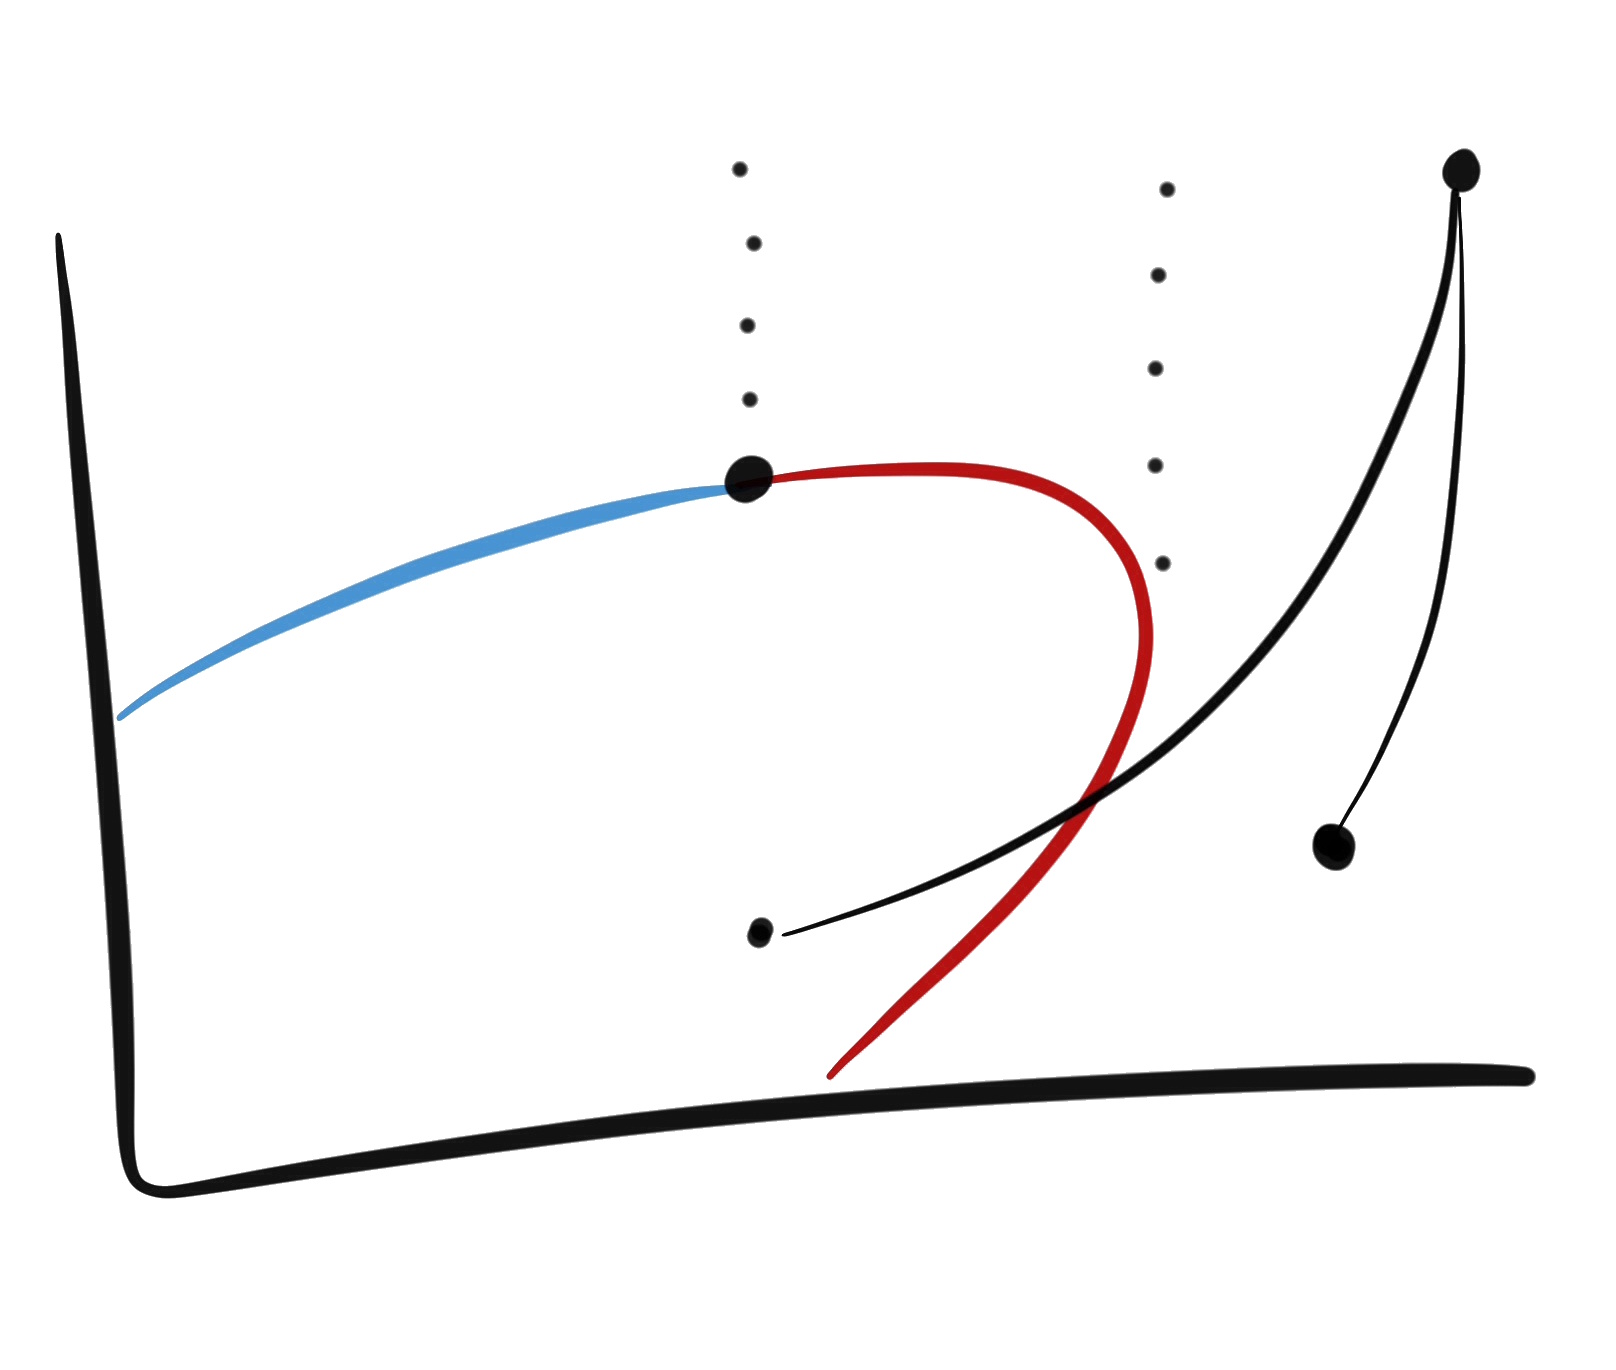
Waterflooding simulator
Sahara features a multilayer injection pattern simulator, allowing well-by-well history matching of production data and generating forecasts using analytical models based on an interconnection pattern system between producer and injector wells.
VLP
Sahara provides the capability to calculate pressure losses for different wells in the project using correlations, allowing the assignment of various curves over time to estimate bottomhole pressures based on wellhead pressure measurements.
PVT
Different PVT tables or correlations can be associated with wells and layers to be used by other tools within Sahara.
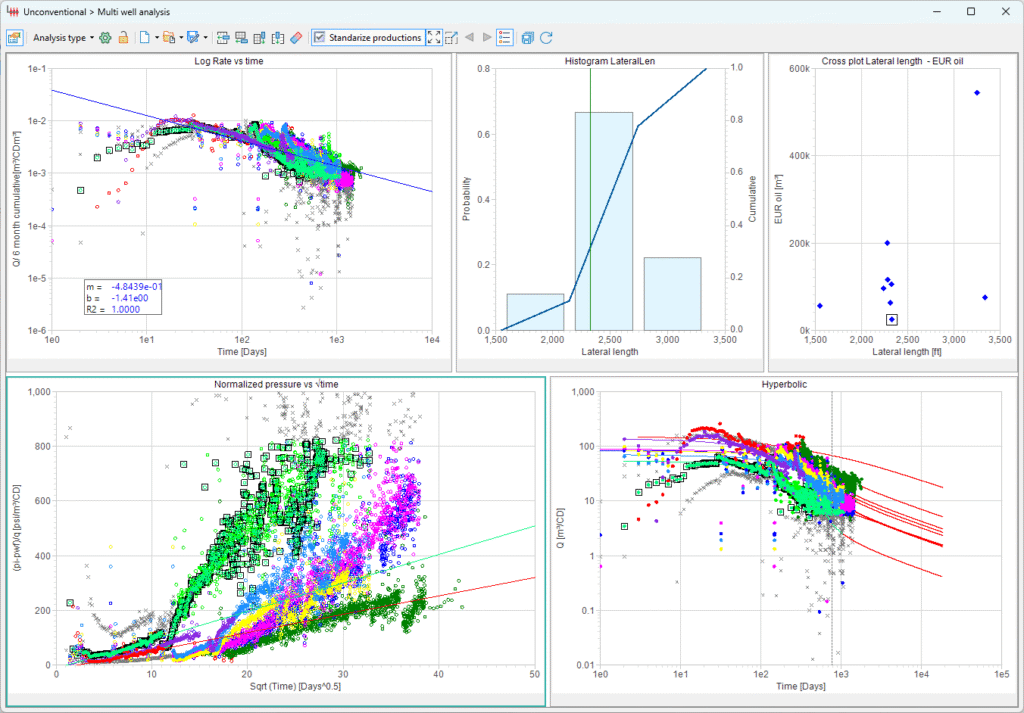
Unconventional
Sahara offers a comprehensive set of tools and methodologies specifically designed to analyze data from unconventional resources, both during completion and production. Production analysis can be performed at the well or well group level.

Miscellaneous
Some complementary tools expand Sahara’s capabilities and make it easier to organize, manage, and perform advanced analysis on projects. From viewing the activity history to integrating with artificial intelligence solutions, these utilities are designed to streamline daily work and maximize the value of your data at every stage of the analysis.